Cluster analysis of taxi trips
Clustering analysis is of helpful here to group trips data and to understand the different usage patterns.
Methods
DBSCAN is used here to cluster the taxi trips data based on the patterns, including pick-up and drop-off location, trip distance as well as pick-up hour. The maximum distance between two samples eps is set as 250 meters. min_samples is set as 50.
Result
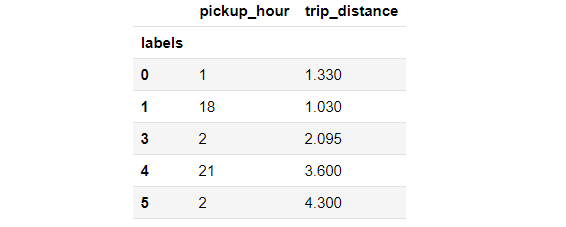
Here, we conduct the analysis based on the trips happened on Jan 3rd, 2015. There are in total 377103 trips were made on that day. After the clustering, the data are divided into 23 clusters. Top five biggest clusters are extracted and visualized. Combined with the maps and the mean pick-up hour as well as the mean trip distance, we can infer the reasons for travel.

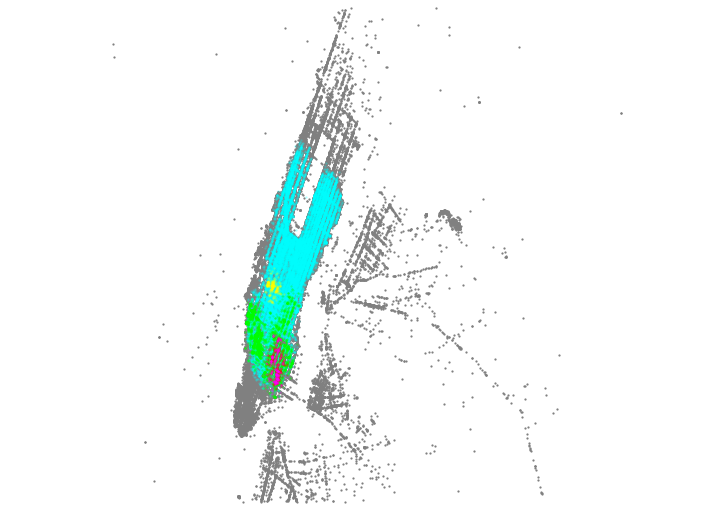
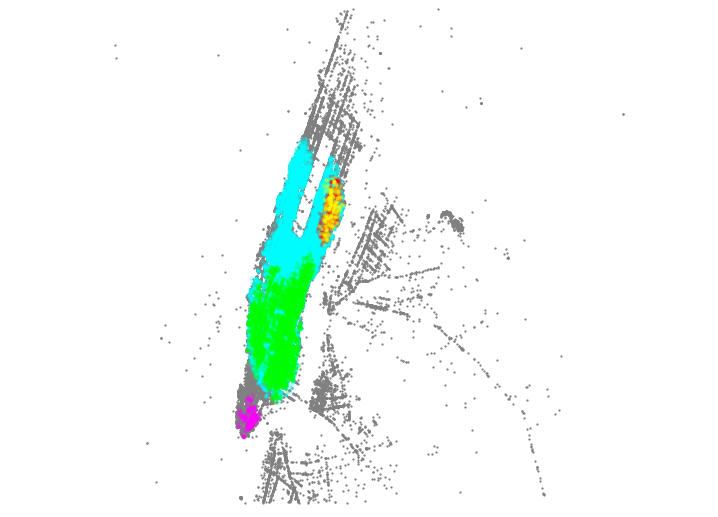
Based on the pick-up and drop-off location of the trips points in the top five clusters, we visualize patterns in the taxi trips. The color scheme is


For example, for the yellow clusters which is the fifth biggest clusters in the table. For these trips, the pick-up hour is about 2:00 am and trip distance is relatively long. These trips started from the Midtown West to Upper East Side. We can infer that the reasons for the trips might be to go home after a wonderful Friday night.
Also, the number of each cluster in each taxi zones are computed and mapped. By the maps, we could easily know the distribution of certain type of trips.