Prediction of Taxi Demand Using Random Forest
Introduction
Random forest regression model is built here to predict the demand of taxi in a certain space unit across the Manhattan. We focus on the demand in each taxi zones, which are roughly based on NYC Department of City Planning’s Neighborhood Tabulation Areas (NTAs). The predcition result provide an overall view of taxi trips made in each taxi zone the next day. Here are some predictors we think that would be related to the number of taxi trips:
- Number of restaurants in each taxi zone,
- Number of stores in each taxi zone,
- Number of subway stops in each taxi zone,
- Percent of people commuting by taxi of each taxi zone,
- Median income of each taxi zone.
- whether rain or not on the day when trip was made
- Mean temperature of the day when trip was made
- Is the day when trip was made weekend?
Data Processing
Taxi trips data is downloaded using pandas.read_parquet. Taxi zones data is provided by NYC Open Data. There are in total 11842094 records and we only focus on the trips made in 2nd week of 2015.
Data from Open Street Map
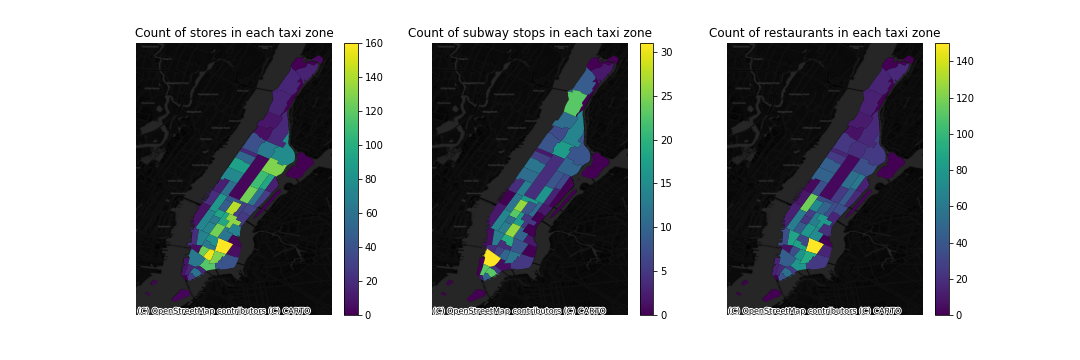
Location data of restaurants, stores, and subway stops could be easily downloaded by using osm2gpd package. By using spatial join sjoin and groupby, the number of the facilities in each taxi zone could be easily calculated and is diplayed in the figure below.

Census Tract Data
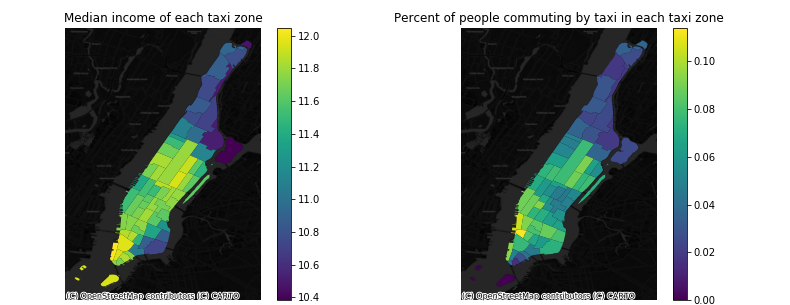
Median income, number of people commuting by taxi and number of commuters are extracted from American Community Survey 5-Year Data.

Weather data
Weather data is ASOS-AWOS-METAR Data. Daily mean temperature and mean precipitation data are included in the regression model to increase accuracy.

Predcition result
RandomForestRegressor is used to build the regression model. Taxi trips made on Monday, Tuesday, Wednesday, Friday and Sunday in the 2nd week of 2015 are set as training data set, and trips made on Thurday and Saturday are set as test data set. The correltion between each two predictors is plotted.

A simple grid search is run to optimize our hyperparameters. n_estimators is 200, and max_depth is 5 in the model. The test score of the prediction is 0.91, whereas the score is 0.40 when using linear regression model. The top important predictor is the count of stores in each taxi zone.
For test set data, MAE is 1828.39. The mean value of the taci trips made on these two days is 6593.24. We map the absolute error and more should be done to make the model more generalizable.

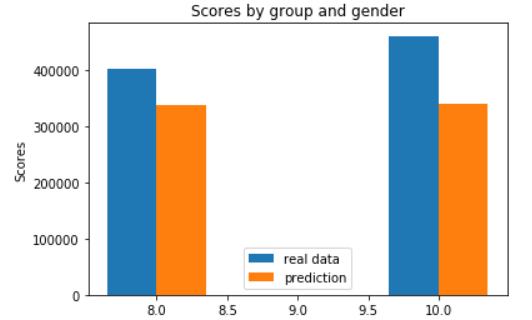
The model perform better for weekday demand prediction, which probably because lack of the training data for weekend.

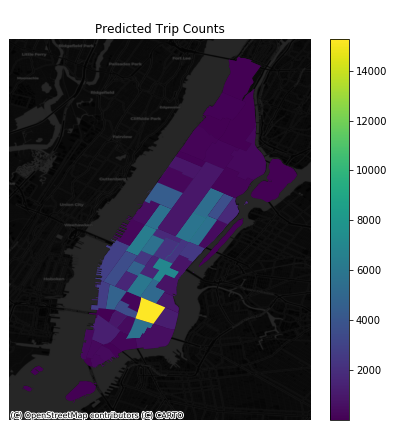
We map the predicted and actual demand and our prediction model detect the general trend of demand across the space. To make our model more accurate, more predictors could be added into the model.

Based on the result, we can conclude that the model is generally good to predict the demand of taxi in NYC. Greater amount of data and more strongly related predictors would make the model better.